x <- 5

x = 5 #Does the same thingWeek 1 Lab: Introduction to R, VS Code, and Github Copilot
This lab is intended to get you started with R programming and using VS Code with GitHub Copilot. If you have experience with R, this will be a review and you can skip ahead to the lab assignment. You can also help your neighbor out if they are new to R. If you have not used VS Code, tune in near the end of the lab to get set up with GitHub Copilot.
Introduction to R
Welcome to the world of R programming! R is a powerful and widely used programming language in the field of data analysis and statistical computing. It is known for its vast collection of libraries and packages that allow users to easily perform complex data manipulation and analysis tasks.
Before we get started, you will need to install R on your computer. You can download the latest version of R for free from the official website https://cran.r-project.org/. Once the installation is complete, you will also need to install RStudio, a popular integrated development environment (IDE) for R. You can download RStudio from the official website https://rstudio.com/.
RStudio provides a user-friendly interface for working with R and offers a variety of features to make working with R easier and more efficient. Open up RStudio and you should see something that looks like this:
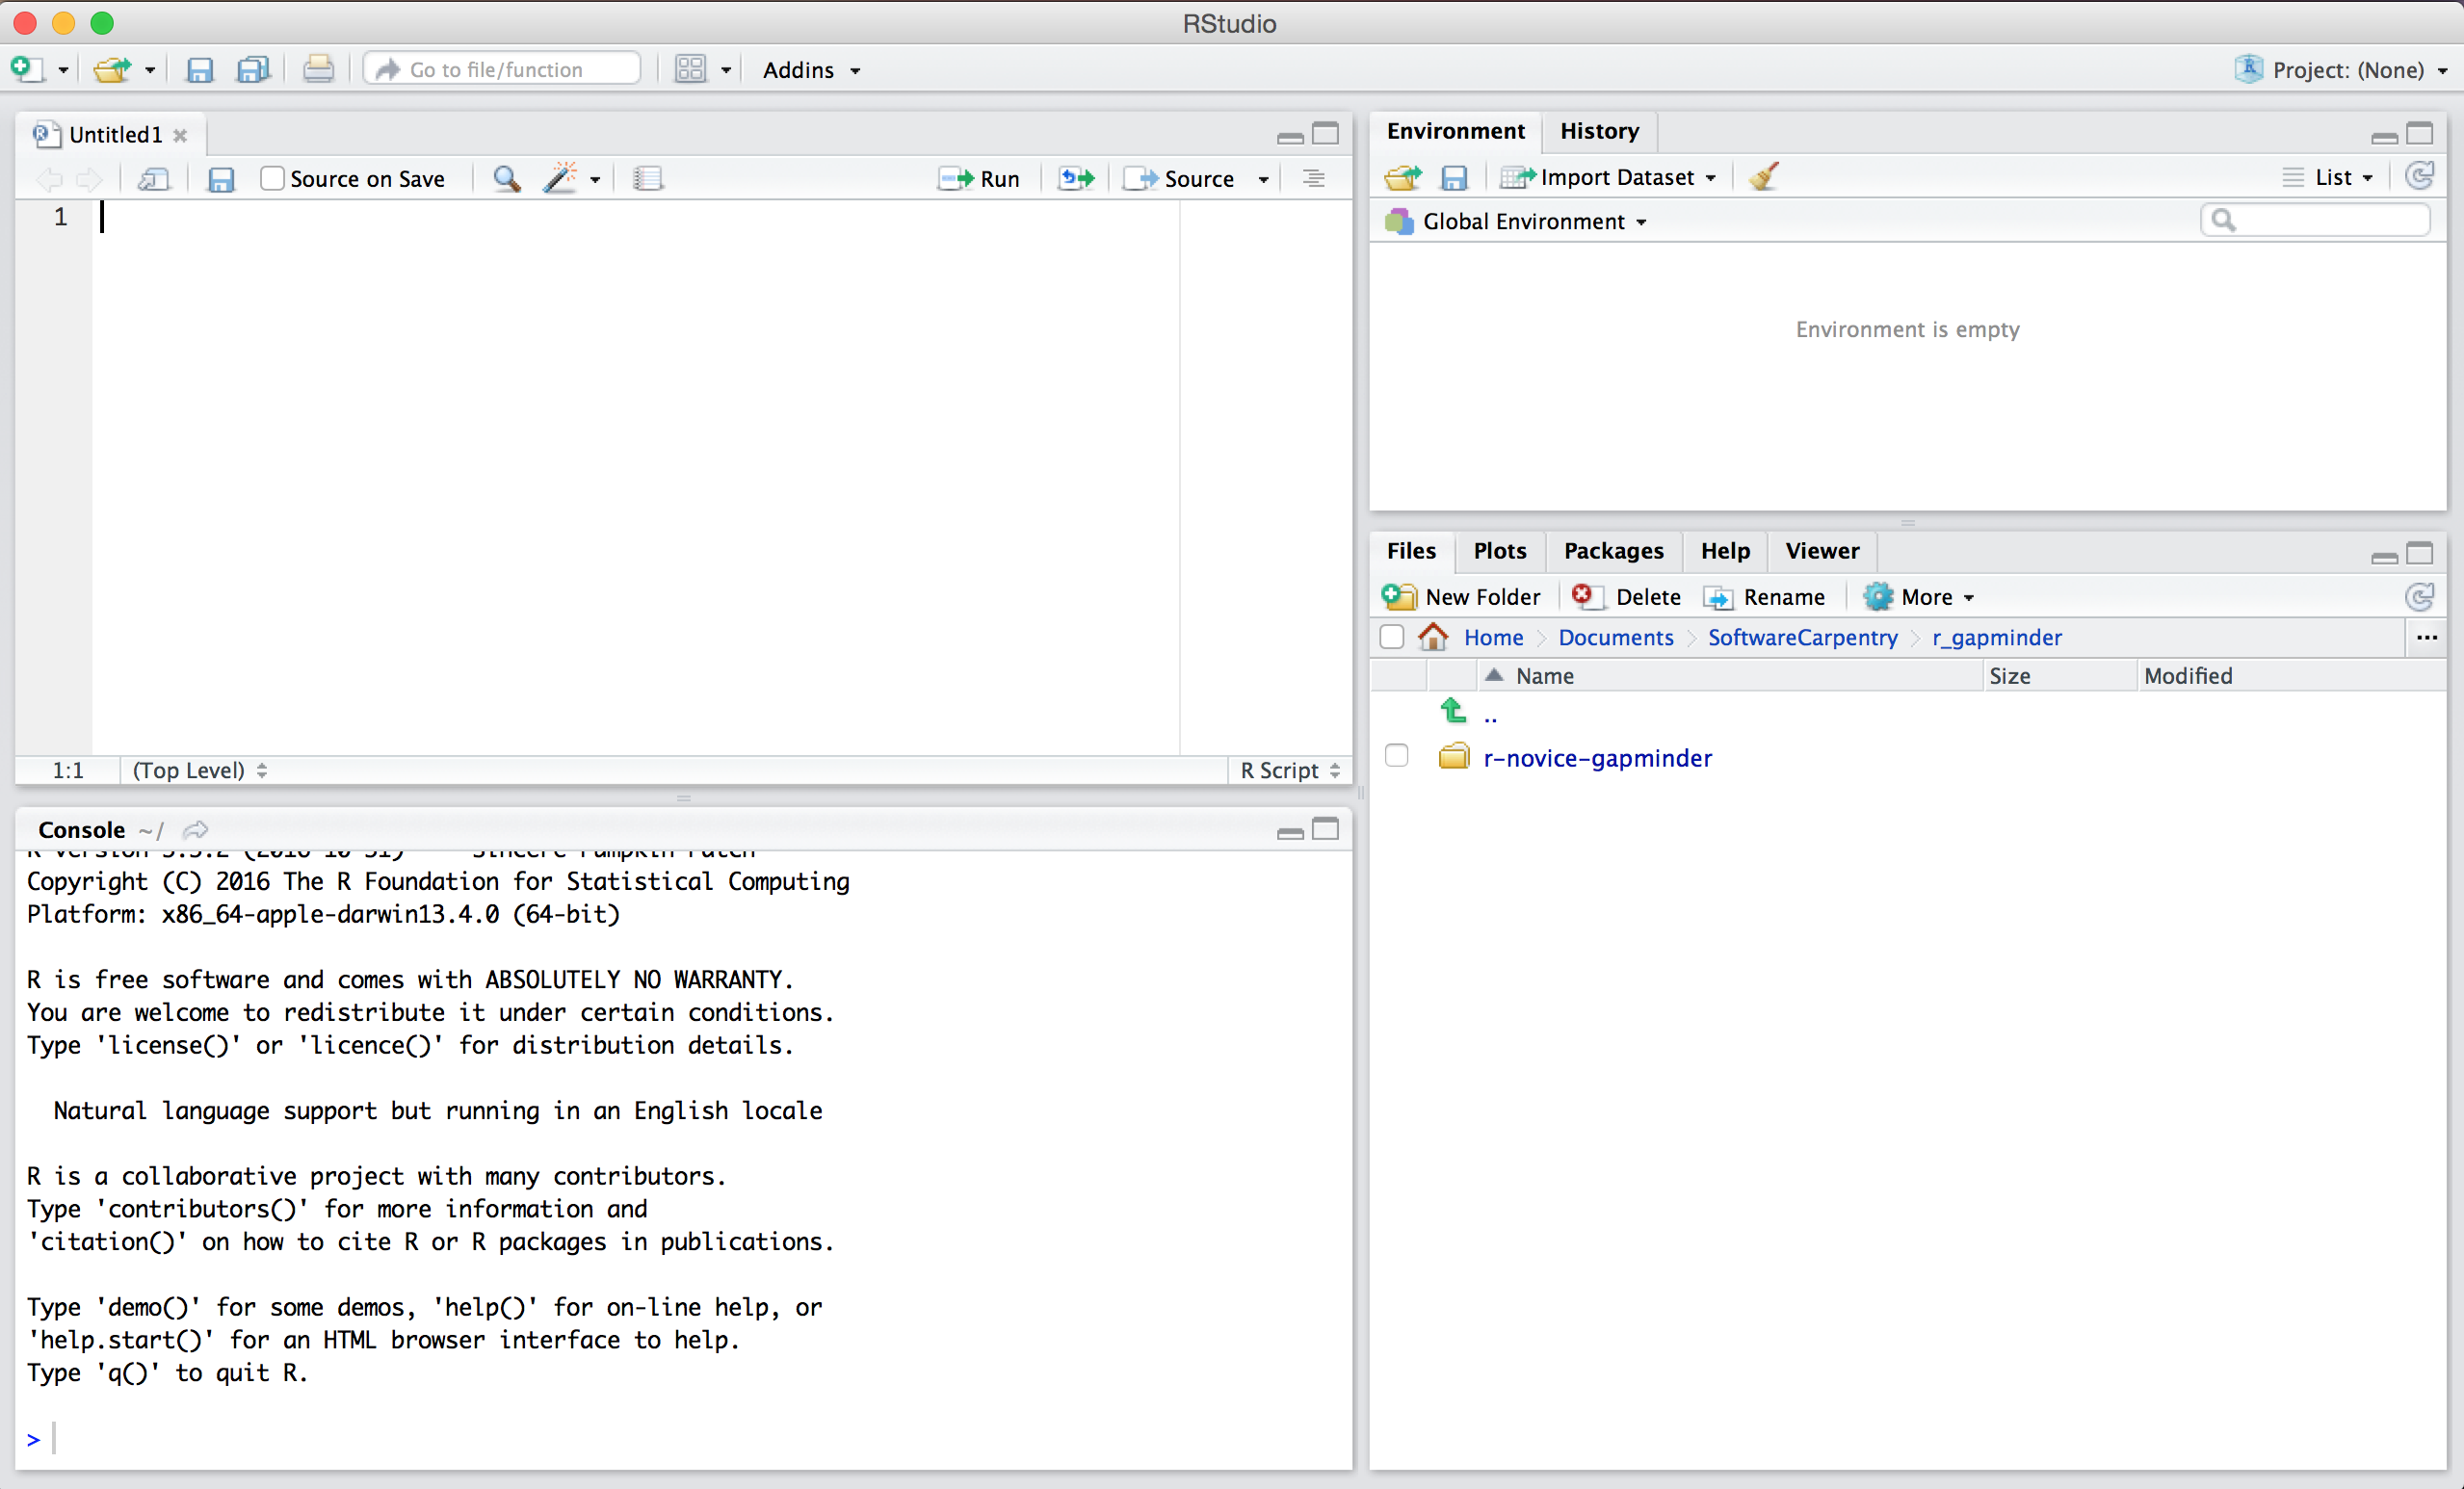
The RStudio interface is divided into several panels:
The Console panel is where you can enter and run R commands.
The Source panel is where you can open and edit R scripts, which are files that contain R code.
The Environment and History panels display information about the current environment and command history.
The Files, Plots, Packages, and Help panels provide access to various resources and tools.
Now that you have both R and RStudio installed and running, let’s dive into some basic concepts of the R programming language.
First, R is an interpreted language, which means that you can enter commands directly into the console and see the results immediately. You can start the R console by opening RStudio and clicking on the “Console” tab.
Basics
To assign a value to a variable in R, you can use the assignment operator <- or = like this:
Here, we have created a variable called x and assigned it the value of 5. Anything following the hashtag on the same line is interpreted as a comment and not executed. Once you assign a variable a value, you can see it in your environment panel. You can use the print() function to display the value of a variable:
print(x)[1] 5Stop and open a new R script. Because R is a command-line application, we can write a script (i.e., text file) with a sequence of commands. There are many benefits to scripting. First, you can save a record of the commands if you need to reproduce the analysis. Second, you can share it with others so they can reproduce it. Third, you can easily change a part of your script to see what happens.
You can also perform basic arithmetic operations in R using the standard operators (+, -, *, /):
y <- 3
z <- x + y
print(z)
[1] 8First, we assign the variable y the value 3. Then, we assign z the value of x (assigned 5 earlier) plus y (just assigned 3), which sum to 8.
Comprehension check: Try assigning the variables a and b different values and dividing them.
Data types
R also has a wide range of data types, including: numerical, character, and logical. Variables can be different datatypes. Collections of variables are called a vector - a one-dimensional array of data. You can create a vector using the “c()” function, which stands for concatenate. A vector may only contain one type of data.
numbers <- c(1, 2, 3, 4, 5)
characters <- c("a", "b", "c")
logical <- c(TRUE, FALSE, TRUE)
Indexing
A single entry in a vector is called an element. You can access elements of a vector using the square bracket notation:
print(numbers[1])[1] 1Comprehension check: Try accessing a different element of the vector numbers or one of the other vectors.
You can also access series of elements in the vector. To access a continuous range of values use the colon :
print(characters[2:3])[1] "b" "c"You can even use a vector of index values to call discontinuous subsets of the vector.
print(characters[c(1,3)])[1] "a" "c"Depending on the data type, there are functions that operate on the vector. For example, you can sum the elements of the numeric vector numbers.
print(sum(numbers))[1] 15Comprehension check: Can you sum the numbers of the vector characters? How about logical?
Challenge: Can you figure out how to calculate the product of the vector numbers?
You can also add, subtract, multiply, and divide all of the numbers in a vector
print(numbers+5)[1] 6 7 8 9 10Or add, subtract, multiply, and divide numbers of equal-length vectors
print(numbers + numbers*2)[1] 3 6 9 12 15data.frames
Using R like a fancy calculator is intended to help you understand how R works. R is generally used to analyze data sets. Data sets are collections of equal-length vectors in a table or what R calls a data.frame. Here is a simple example:
print(data.frame(a=c(1:3),
                 b=c(4:6),
                 d=c(7:9)))
a b d
1 1 4 7
2 2 5 8
3 3 6 9Where a,b,d are the column or variable names and the 1,2,3 on the far left are row numbers.
You can build a data.frame using the vectors above and assign the object a name.
df <- data.frame(numbers=numbers[1:3],
                 characters,
                 logical)

print(df)
numbers characters logical
1 1 a TRUE
2 2 b FALSE
3 3 c TRUEComprehension check: Why did I subset the vector numbers?
Packages or Libraries
Finally, R has a vast collection of libraries or packages that provide a wide range of functions for data manipulation and analysis. Since R is open source, anyone can write libraries and share them with the world.1 You can install and load a package using the “install.packages()” and “library()” functions:
#Run only once
#install.packages("dplyr")
library(dplyr)
Attaching package: 'dplyr'The following objects are masked from 'package:stats':
filter, lagThe following objects are masked from 'package:base':
intersect, setdiff, setequal, unionHere, we have installed and loaded the “dplyr” package, which provides a wide range of functions for data manipulation. Note that you only need to install packages once, but you need to load them using the library() command each session. If you are working on the server, the packages you need will be installed; you just need to load them.
Running scripts and saving output
We have been building a script (a text file with a series of commands in R - like a recipe). Suppose that script analyzed some data and produced some outputs. You may want to have R run all of the commands in your script. The command to run a script in R is: source(). There is also a button called source in the upper right corner of the source panel. You can call that command directly in the R console. Suppose you have an R script called lab_01_example.R in your current working directory. You can check your working directory with getwd() in the R console. You can run the R script by typing the following in the console: source("lab_01_example.R",echo=TRUE). The echo argument set to TRUE tells R to print the output of each command.
Assignments in this class will require you to demonstrate that your code runs without errors. You can use source() along with another function called sink() to generate a log file that you can use to show evidence that your R code runs. To create a log file that demonstrates the script, lab_01_example.R, runs, open a new script and type the following three commands (lines) into the new script (or directly into the R console):
sink(file = "lab_01_example.log")
source("lab_01_example.R",echo = TRUE)
sink()
The sink() command is strange - it opens an active connection to a blank text file called lab_01_example.log in the current working directory, then writes the output of any following commands (i.e., source("lab_01_example.R",echo = TRUE)) into that file. The last sink() command simply closes the connection, so you can keep using R without writing everything to your log file.
Documentation
Documentation is critical to understanding how functions and packages work in R. There is a help tab in the lower right panel in RStudio. You can also place your cursor in the function name in your code and press F1 to bring up the help for that function. R documentation always provides a brief description, information about arguments (or inputs), information about outputs, and some examples of how you would use it. Learning to read the documentation is critical for learning new packages.
Here are some additional resources to help you get started with R:
Introduction and RStudio setup: https://youtu.be/dFSPmjSynCs
data.frames: https://youtu.be/ULjXUW5yeDM
packages and libraries: https://youtu.be/l5bmDv98zX4
Introduction to VS Code
Visual Studio Code (VS Code) is a free, open-source code editor developed by Microsoft. It is a popular choice among developers due to its versatility, ease of use, and extensive range of features. VS Code supports a wide range of programming languages and provides a variety of tools and extensions to enhance the coding experience.
While I still prefer RStudio for R programming, VS Code is a great general-purpose code editor that has better AI integration. Before we get to the AI integration, lets configure VS Code to run R code.
Find the extensions tab on the left panel of VS Code. Search for and install the extension called “R”. This extension allows you to run R code in VS Code.
Let’s find the script we wrote in RStudio and run the commands in VS Code.
Enable GitHub Copilot in VS Code
- Confirm you have GitHub Education benefits with Copilot access (sign in to https://education.github.com and ensure Copilot is enabled on your account).
- In VS Code, open the Extensions panel (⇧⌘X / Ctrl+Shift+X), search for “GitHub Copilot”, and install the extension published by GitHub.
- Click “Sign in” when prompted and complete the GitHub login so Copilot activates under your account.
- Install “GitHub Copilot Chat” and sign in to access chat-based help in the sidebar.
- Need a walkthrough? See:
- Official VS Code setup guide: https://code.visualstudio.com/docs/copilot/setup
Prompt for additional practice
Enter the following prompt into your favorite LLM:
You are an interactive R tutor for absolute beginners. I use RStudio. I want short, clear explanations, runnable base‑R code, and small exercises I can complete in 5–10 minutes each.

Please:

Start with a one‑paragraph Overview of the topic I asked for.

Use only R’s built‑in datasets (examples: mtcars, iris, airquality, PlantGrowth, ChickWeight, Orange) — do NOT include examples that read external files or call read_*() functions.

Use only base R (do NOT suggest or use packages like dplyr, ggplot2, or others).

Do NOT include any plotting examples or plotting functions.

Show a minimal, runnable R script (complete, copy‑paste ready) and explain each line with one short sentence.

Use base‑R functions for data inspection (examples: head(), tail(), str(), summary(), nrow(), ncol(), names()).

Show commands I should run in my R console in backticks (e.g., getwd(), source("my_script.R")).

Give 3 tiny practice tasks (one‑line each) with succinct solutions shown separately.

Add a short "Troubleshooting" bullet list with 5 common beginner errors and quick fixes (e.g., object not found, wrong indexing, factor vs character, NA handling, package-not-needed reminders).

End with 2 suggested Next steps (what to learn next) and 2 helpful Links.

Tone: friendly, concise, patient. Label sections exactly: Overview, Script, Line-by-line, Run, Exercises, Troubleshooting, Next steps, Links.
Get started on the problem set here: Lab Assignment)