%%{init: {"themeVariables": {"fontSize": "24px"}}}%%
flowchart LR
  G[Goals] ==> P[Problem]
  P ==> Q[Question]
  Q ==> Da[Data]
  Da ==> M[Model]
  M ==> R[Result]
  R ==> D[Decision]
Week 4: Joining and Merging Data
Big Picture:
Corn Yield and Drought
What is the USDA’s goal?
Problem?
Question?
You have county-year yield data, but weather data are monthly. What should you do before merging?
A. Drop the weather data because it is higher frequency.
B. Aggregate weather to the county-year level to match the unit of observation.
C. Duplicate yield rows to match each month.
D. Convert yield to monthly values by dividing by 12.
Which handling of missing values preserves information about missingness itself?
A. Dropping all rows with any missing values. B. Replacing missing values with zero. C. Creating a missingness indicator or category. D. Replacing missing values with the mean.
Motivation: Why Joins Matter
- Deep insights often come from combining datasets
- Errors are hard to detect after models run
- Joins can create bias by selection or duplication
Unit of Observation
- Let the analytic question define the unit of observation
- All joins should preserve the target unit
- Example target unit: county-year
Primary and Compound Keys
- Keys define how tables relate to each other - a concept from relational databases
- Primary key: unique ID for each row
- Compound key: multiple columns define uniqueness
What variables make up the compound key in our corn yield and drought example in lab?
A. state and year
B. county and year
C. year only
D. state only
Joins
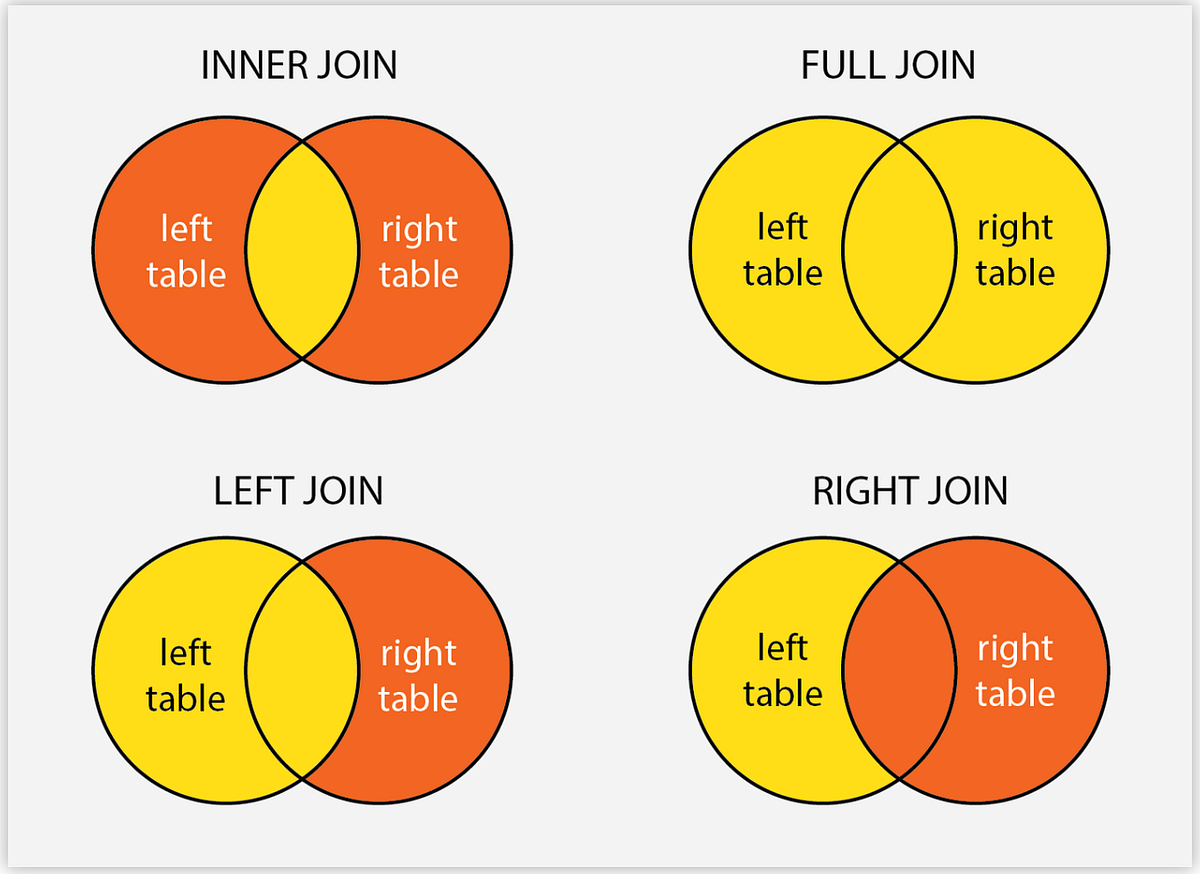
left_join(): keep all rows in left tableinner_join(): keep only matched rowsright_join()/full_join(): mostly for debugging
Example
| state | year | yield |
|---|---|---|
| A | 2020 | 120 |
| B | 2020 | 95 |
| C | 2020 | 105 |
| state | year | drought |
|---|---|---|
| A | 2020 | 0.8 |
| D | 2020 | 0.6 |
What would an inner join create?
Example: Inner Join
| state | year | yield | drought |
|---|---|---|---|
| A | 2020 | 120 | 0.8 |
Only state A appears because it’s the only match.
Example
| state | year | yield |
|---|---|---|
| A | 2020 | 120 |
| B | 2020 | 95 |
| C | 2020 | 105 |
| state | year | drought |
|---|---|---|
| A | 2020 | 0.8 |
| D | 2020 | 0.6 |
What would an left join create?
Example: Left Join
| state | year | yield | drought |
|---|---|---|---|
| A | 2020 | 120 | 0.8 |
| B | 2020 | 95 | NA |
| C | 2020 | 105 | NA |
All yield with drought data for matches
Example
| state | year | yield |
|---|---|---|
| A | 2020 | 120 |
| B | 2020 | 95 |
| C | 2020 | 105 |
| state | year | drought |
|---|---|---|
| A | 2020 | 0.8 |
| D | 2020 | 0.6 |
What would an full join create?
Example: Full Join
| state | year | yield | drought |
|---|---|---|---|
| A | 2020 | 120 | 0.8 |
| B | 2020 | 95 | NA |
| C | 2020 | 105 | NA |
| D | 2020 | NA | 0.6 |
All data from both with drought data for matches
Implicit Assumptions in Joins
- Keys are correctly defined and formatted
- Any observations dropped by inner join are ignorable or acknowledged
- The measurements in each dataset are compatible
Diagnostics Before the Join
- Confirm unit and key definitions
- Check key uniqueness on both tables
- Check overlap and missing keys
- Predict expected row counts
Common Issues
- Many-to-many joins inflate rows
- Key mismatches (types, formatting, leading zeros)
- Temporal mismatch or look-ahead bias
- Unintended selection via inner join
Summary: Joining & Merging Data
- Unit of observation: Define the row (e.g., county-year) and match datasets to it.
- Keys: Use correct primary or compound keys; verify uniqueness and formatting.
- Join type is policy:
left_join()preserves your target sample;inner_join()restricts to matches;full_join()shows all records. - Diagnostics: Compare row counts, check overlaps, detect many-to-many inflations, and inspect duplicated rows.
- Pre-merge step: Aggregate or transform higher-frequency data (e.g., monthly → county-year) before joining.
Project
- Groups of 3
- Find a real world decision that could be informed by data
- Who is the decision maker?
- What is their goal/objective?
- What is the problem they face?
- What is the question they need answered?
%%{init: {"themeVariables": {"fontSize": "24px"}}}%%
flowchart LR
  G[Goals] ==> P[Problem]
  P ==> Q[Question]
  Q ==> Da[Data]
  Da ==> M[Model]
  M ==> R[Result]
  R ==> D[Decision]