How much time do you spend outside of class on AREC 330 each week?
A. 0-1 hours
B. 1-2 hours
C. 2-3 hours
D. 3+ hours
Overall, the class is going…
A. Well
B. OK (neutral)
C. Not well
The material is…
A. Relevant to me
B. Somewhat relevant (neutral)
C. Not relevant to me
The labs are…
A. Easy and straightforward
B. Mixed (some easy, some hard)
C. Very difficult
How can I improve the class? (constructive feedback)
Quick Review: Joins
When is left_join() the preferred choice over inner_join()?
A. When you only want rows present in both datasets.
B. When you want to keep all observations from the primary dataset even if matches are missing in the second dataset.
C. When key variable types differ between datasets.
D. When you need to remove duplicate keys before merging
Big Picture: Corn Yield and Drought
%%{init: {"themeVariables": {"fontSize": "24px"}}}%%
flowchart LR
  G[Goals] ==> P[Problem]
  P ==> Q[Question]
  Q ==> Da[Data]
  Da ==> EDA[EDA]
  EDA ==> M[Model]
  M ==> R[Result]
  R ==> D[Decision]

  style EDA fill:#FFD966,stroke:#333,stroke-width:3px,color:#000
Before You Model, You Must Understand
Models can mislead if you don’t understand the data.
EDA is a critical step to understand the data before modeling.
%%{init: {"themeVariables": {"fontSize": "24px"}}}%%
flowchart LR
Q[Question] ==> Da[Understand Data]
Da ==> EP[Explore Patterns]
EP ==> RQ[Refine Question]
RQ ==> M[Model]
Exploratory Data Analysis
Exploratory Data Analysis (EDA) is the process of:
Understanding the structure of the data
Summarizing distributions and relationships
Identifying anomalies and data quality issues
Generating hypotheses
EDA is not about proving something.
It is about learning what the data is capable of saying.
EDA Roles
EDA can serve multiple purposes:
You are given data and there is no clear question. EDA can help explore patterns.
You are given a question and you have data. EDA can help assess question feasibility and refine if needed.
Role 1: Generate Hypotheses
EDA helps us ask:
Is there a pattern?
Is there a relationship?
Are there clusters?
Are there outliers driving some relationship?
Role 2: Refine the Question
EDA can help us refine our question by:
Assessing the feasibility of the question given the data
Identifying which variables are relevant to the question
Suggesting modifications to the question to better fit the data
You compute summary statistics for state-level farm GDP:
Mean: $4.2 billion
Median: $1.3 billion
Max: $38 billion
Discussion Prompt:
What does this tell you about the distribution?
Is the mean representative of the average US state Farm GDP?
Would you consider transforming the variable? Why?
How might this affect an analysis of the relationship between drought and farm GDP?
Measures of Dispersion
How spread out are the data?
Range: Difference between max and min \[
\text{Range} = x_{\text{max}} - x_{\text{min}}
\]
Example: For {1, 2, 3, 4, 5}, range = 5 - 1 = 4
Variance: Average squared deviation from mean. \[
s^2 = \frac{1}{n-1} \sum_{i=1}^{n} (x_i - \bar{x})^2
\]
Example: For {1, 2, 3, 4, 5}, variance = 2.5
Why do we square the deviations?
Standard Deviation: Square root of variance, in same units as data. \[
s = \sqrt{s^2}
\]
Example: For {1, 2, 3, 4, 5}, standard deviation = \(\sqrt{2.5} \approx 1.58\)
Percentiles
Percentiles: Value below which a given percentage of data falls.
\[
P_k = \text{value such that } k\% \text{ of data} \leq P_k
\]
Common percentiles: 25th (Q1), 50th (median), 75th (Q3)
You may see interquartile range (IQR) = Q3 - Q1
Example: For {1, 2, 3, 4, 5},
2 is the 30th percentile,
3 is the 50th percentile (median),
4 is the 70th percentile.
Using the midpoint method for percentiles, \[
P = \frac{R-0.5}{n} * 100
\] where \(R\) is the rank of the value in the sorted data and \(n\) is the total number of observations.
Measures of Relationship
Covariance: Measures how two variables vary together. \[
\text{Cov}(X, Y) = \frac{1}{n-1} \sum_{i=1}^{n} (X_i - \bar{X})(Y_i - \bar{Y})
\]
What is \(\text{Cov}(X, X)\)?
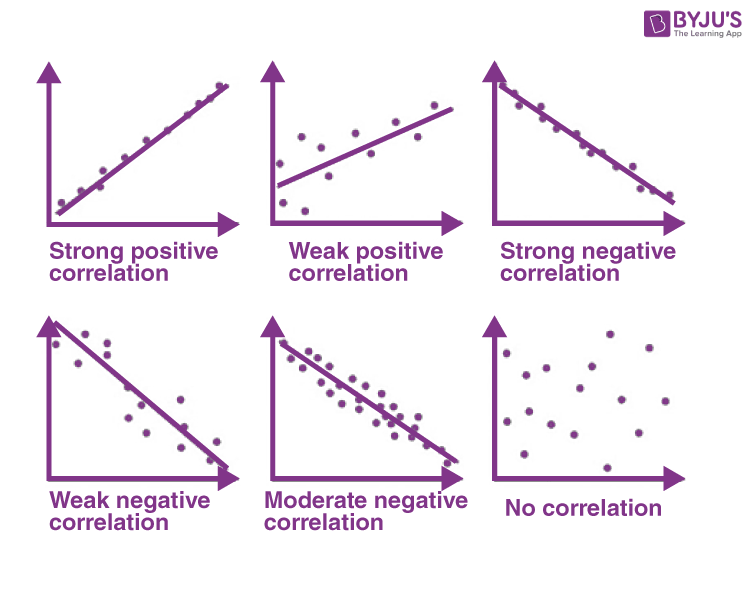
Correlation: Standardized measure of linear relationship between two variables. \[
r = \frac{\text{Cov}(X, Y)}{s_X s_Y}
\]recall: \(s_X\) and \(s_Y\) are the standard deviations
\(r\) ranges from -1 to 1, where:
\(r = 1\): perfect positive linear relationship
\(r = -1\): perfect negative linear relationship
\(r = 0\): no linear relationship
Visualizing Correlation
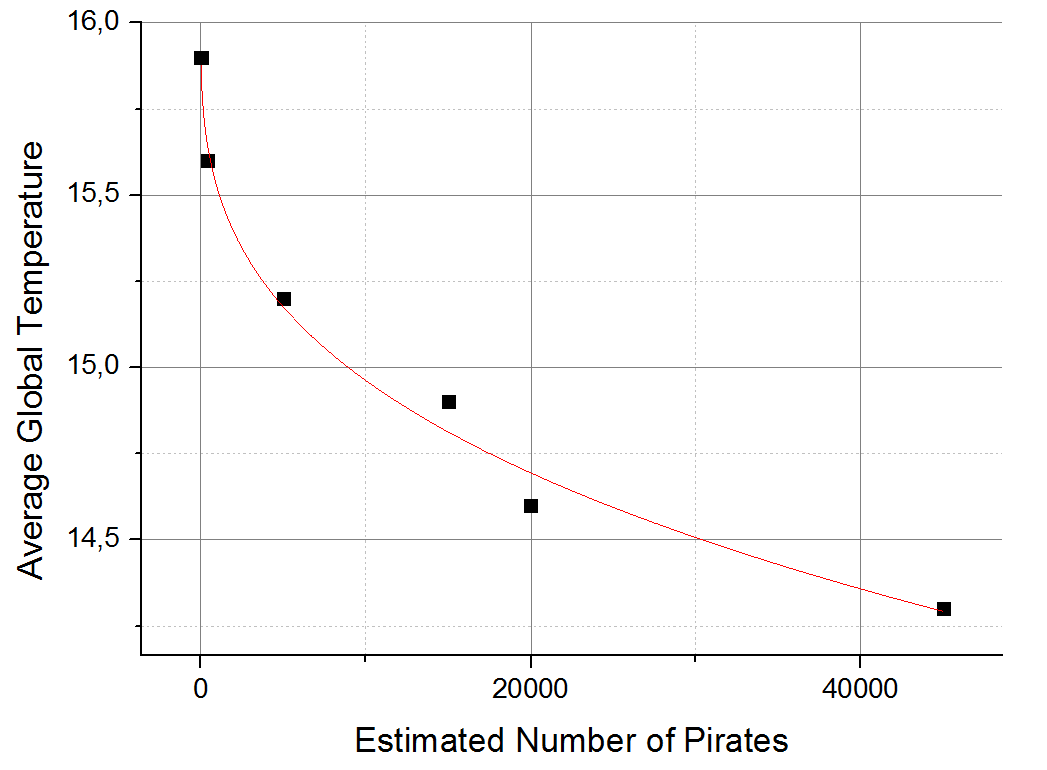
Correlation ≠ Causation
EDA is not busy work. It produces deliverables.
Develop a Data Dictionary
A data dictionary is a document that describes the structure, content, and meaning of a dataset. It typically includes:
Variable names and descriptions
Data types (e.g., numeric, categorical)
Units of measurement
Possible values and their meanings (for categorical variables)
Any data transformations applied
Missing value codes and handling
Source of the data
Data dictionaries are useful for you but also for others who may use the data in the future.
They help ensure that everyone understands the data in the same way and can use it appropriately.
Data Quality Report
A data quality report is a document that assesses the quality of a dataset. It typically includes:
Summary statistics (e.g., mean, median, standard deviation)
Distribution of values (e.g., histograms, boxplots)
Missing data patterns (e.g., percentage of missing values, missingness by variable)
Outliers and anomalies (e.g., extreme values, inconsistent entries)
Data consistency checks (e.g., duplicate records, invalid values)
Data quality issues and recommendations for cleaning or handling them
A data quality report helps identify potential issues with the data that could affect analysis and modeling.
It also provides a basis for making informed decisions about how to handle data quality problems.
Summary
EDA has two core roles:
Generate hypotheses
Refine questions
Summary statistics are tools for insight, not formulas to memorize.
EDA produces outputs:
Data dictionary
Data quality report
Good analysts document what they learn from data before modeling it.