%%{init: {"themeVariables": {"fontSize": "24px"}}}%%
flowchart LR
  P[Past Data] --> E[Extract Patterns]
  E --> F[Forecast + Uncertainty]
  F --> C[Decision Costs]
  C --> D[Operational or Policy Decision]
  D --> L[Learn and Update]
  L --> E
Week 6: Forecasting for Decision-Making
Forecasting for Decision-Making
From patterns in data \(\rightarrow\) real-world decisions
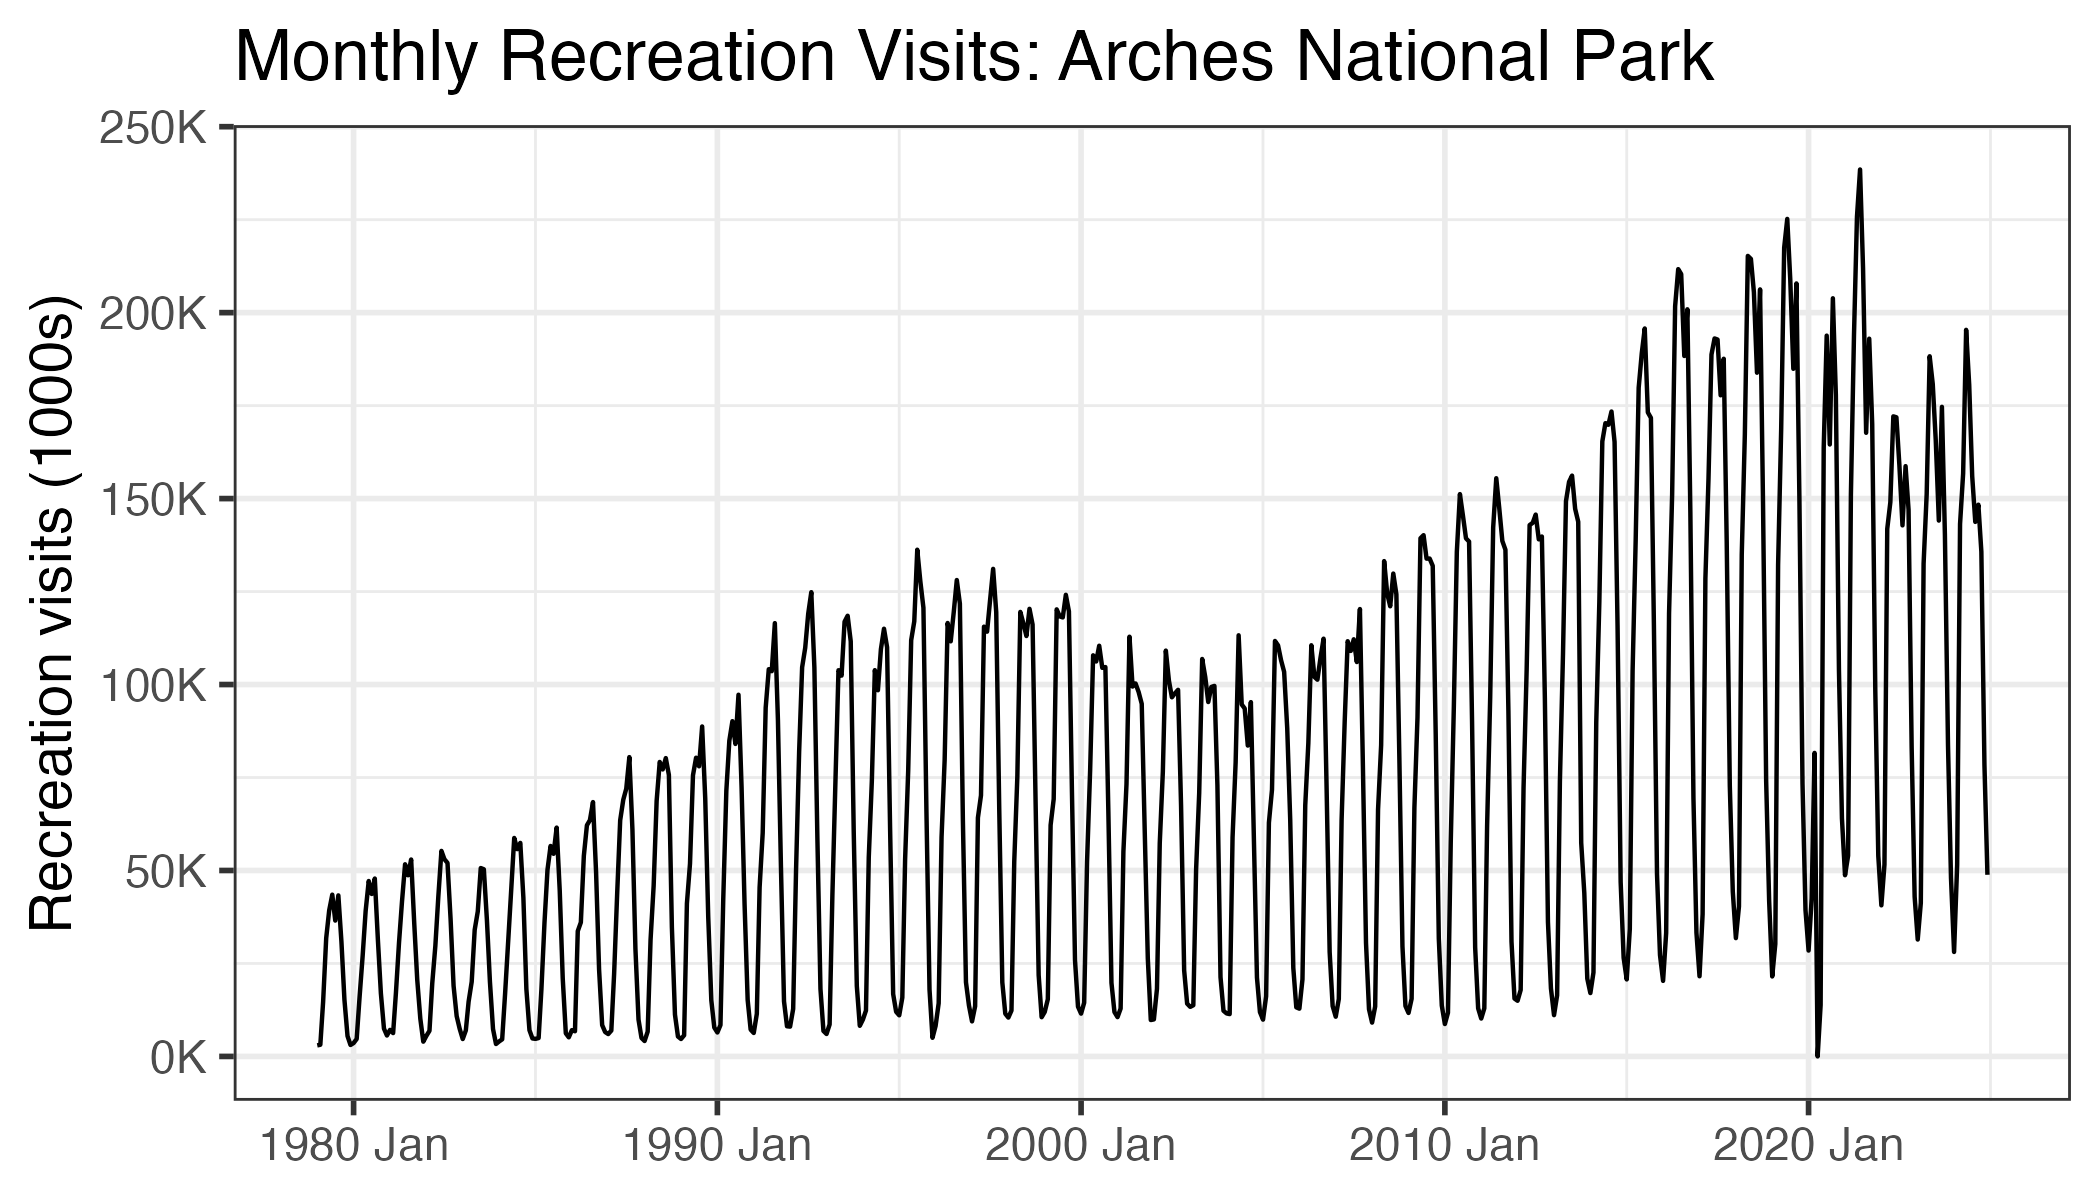
Opening Scenario: Arches National Park
It is October. You must decide for next summer:
- How many seasonal staff to hire
- Whether to implement reservations
- How many shuttle buses to contract
- How much overtime to budget
What information do you wish you had?
Expected visitation.
Forecasting reduces uncertainty about the future.
What Is Forecasting?
Forecasting is:
A transparent, testable prediction about future values based on past patterns.
Forecasting is not:
- Guessing
- A crystal ball
- A guarantee
Forecasting is:
- A model of how the world has behaved
- With quantified uncertainty
- Evaluated on held-out data
Why Forecasting Matters in Business and Policy
Operations
- Staffing
- Inventory
- Capacity planning
Finance
- Revenue projections
- Budgeting
- Capital planning
Public policy
- Emergency planning
- Infrastructure investment
- Tourism management
Forecasting Is About Decisions
A forecast is useful only relative to the decision it informs.
Two models can have similar accuracy, but:
- One consistently overpredicts
- One consistently underpredicts
Those create different costs.
- Overpredict visitation \(\rightarrow\) overspend on staffing
- Underpredict visitation \(\rightarrow\) overcrowding and safety risk
Forecast evaluation must consider decision costs.
Example: Arches National Park
The Forecasting Problem
Every forecast must answer:
- What patterns exist?
- Trend
- Seasonality
- Cycles
- Shocks
- Will those patterns continue?
- How uncertain are we?
Sources of Predictability
Time series are easier to forecast when:
- Trend is persistent
- Seasonality is stable
- Autocorrelation is strong
Forecasting is harder with:
- Sudden policy changes
- Structural breaks
- Technological shifts
- Extreme shocks
The Role of Benchmarks
Benchmarks are simple forecasts that set a baseline for performance.
Can you beat the guess: “this month-year will look like the same month last year”?
Seasonal naive is strong because:
- Seasonality is often dominant
- No parameter estimation required
- It adapts automatically
Train/Test Split and Honest Evaluation
Never evaluate a forecast on data used to estimate it.
- Training set \(\rightarrow\) estimate model parameters
- Test set \(\rightarrow\) simulate future performance
Without out-of-sample evaluation, you reward overfitting.
What Makes a Good Forecast?
Not just low error.
A good forecast is:
- Transparent
- Interpretable
- Stable across samples
- Appropriate for the decision horizon
Different horizons imply different model choices.
Forecasting Horizon Matters
Short horizon:
- Autocorrelation dominates
- Naive methods are often strong
Long horizon:
- Trend assumptions dominate
- Structural change risk increases
Would you use the same model for:
- Next month?
- Next year?
- Ten years?
Forecasting Under Policy Change
Arches reservation policy:
- Introduced in 2020
- Removed in 2026
Key modeling question:
Should you assume:
- Past pattern continues?
- New regime starts?
- Structural break at policy change?
Forecasting involves causal reasoning, not just extrapolation.
Forecasts and Uncertainty
Point forecast \(\neq\) full forecast.
Decision-makers need:
- Prediction intervals
- Range of plausible outcomes
- Worst-case planning inputs
- Risk assessment context
Applications:
- Fire risk planning
- Tourism congestion management
The Economic Cost of Forecast Errors
Suppose July error is 50,000 visitors.
What does that mean economically?
- Staff shortfall or overstaffing
- Parking congestion
- Lost revenue opportunities
- Overtime and contracting costs
MAE and RMSE are proxies for decision cost.
When Forecasting Fails
Forecasts fail when:
- Structural breaks occur
- Policy changes behavior
- Climate shocks hit demand
- Pandemics disrupt patterns
- Models extrapolate unstable trends
Most models assume the future resembles the past.
That assumption is fragile.
Why Decomposition Makes Sense
Most economic time series combine:
- Trend
- Seasonality
- Irregular shocks
Decomposition helps by:
- Separating patterns
- Improving interpretability
- Supporting better forecasts
\[ y_t = T_t + S_t + R_t \]
Forecasting Is Iterative
Forecasting is not: fit once, done.
Forecasting is:
- Fit
- Evaluate
- Diagnose bias
- Update assumptions
- Refit
Especially important when policy regimes change.
Linking Back to Business Analytics
In this course pipeline:
- EDA \(\rightarrow\) understand structure
- Modeling \(\rightarrow\) estimate relationships
- Forecasting \(\rightarrow\) project forward
- Evaluation \(\rightarrow\) test performance
- Decision \(\rightarrow\) allocate resources
Forecasting is the bridge between data and planning.
Discussion Prompt
If Arches removes reservations in 2026, how would you forecast 2027 visitation?
Possible strategies:
- Ignore reservation-period years
- Add a policy indicator
- Weight pre-policy years more heavily
- Build scenario forecasts
Optional 10-Minute Case Activity
Scenario: “Visitation is expected to be 15% higher than last year.”
Before hiring 20 more seasonal staff, what else do you need?
- Forecast uncertainty and interval width
- Timing within the season
- Budget constraints
- Operational bottlenecks
Forecasts support decisions under uncertainty.
Big Takeaway
Forecasting is not about predicting perfectly.
Forecasting is about:
- Quantifying uncertainty
- Improving decisions
- Learning from forecast errors
- Updating beliefs with new data